A statistical history of major league batting, 1871–2025

The Box Score

How 155 seasons of hitters traded contact for power, told through 106,470 batting lines.

This report uses every batting line in the Lahman Baseball Database — 106,470 player-team-seasons from 1871 through 2025 — to trace how hitting in the major leagues has changed. The short version: hitters today swing for power and strike out more than ever. Strikeouts have outnumbered hits every season since 2018, the league batting average is near its lowest level since 1968, and the .300 hitter has almost disappeared. Along the way the player pool has changed too: nearly three in ten players are now born outside the United States.

BY THE NUMBERS

Select a number to see how it was calculated.

Explore the dashboard

Filter every batting line by season, team, league, batting hand and birthplace.

Part one

Home Runs vs. Strikeouts

Finding 1

Strikeouts have outnumbered hits every season since 2018

For most of baseball history a strikeout was far rarer than a hit. In 1920, AL and NL batters collected 23,275 hits and struck out only 7,247 times — more than three hits for every strikeout. The gap closed steadily for a century. In 2018, strikeouts (41,207) passed hits (41,018) for the first time, and they have stayed ahead in every season since, including 2025 (40,645 strikeouts vs. 40,138 hits).

The dip in 2020 is the 60-game pandemic season, not a change in approach.

Total hits and strikeouts per season, AL + NL, 1901–2025.

  • Hits
  • Strikeouts

Finding 2

The strikeout rate has more than doubled since the Live Ball era

Measured per plate appearance, the change is just as stark. During the Live Ball era (1920–41) hitters struck out in 8.0% of plate appearances. The rate rose in almost every era after that, reaching 16.6% in the Steroid era and 20.5% in the Modern era (2006–25). The single-season record is 23.4% in 2020; in 2025 it was 22.2%.

Today, more than one plate appearance in five ends in a strikeout.

Strikeouts ÷ plate appearances, AL + NL, 1876–2025.

Finding 3

The home run rate peaked in 2019

The trade-off for all those strikeouts is power. Home runs came in 0.67% of plate appearances in 1920; by 2019 the rate had climbed to 3.63%, the highest in history — roughly one home run every 28 trips to the plate. That season 58 players hit 30 or more home runs, more than in any other year, and more than in the peak Steroid-era seasons of 1999 (45) and 2000 (47).

The rate has eased since then, to 3.09% in 2025, but remains far above any season before 1994.

Home runs ÷ plate appearances, AL + NL, 1876–2025.

Finding 4

Singles make up a shrinking share of hits

In the National League's first season, 1876, 84.0% of all hits were singles. That share has fallen almost continuously as hitters traded contact for extra-base power. It hit its low point of 61.7% in 2019 — the same year as the home run peak — and was 65.1% in 2025.

Put another way: over a third of today's hits go for extra bases, compared with about one in six in 1876.

Singles ÷ hits, AL + NL, 1876–2025. Singles = hits − doubles − triples − home runs.

Part two

Eras of Offense

Finding 5

The Live Ball era was the best time to hit for average

After the dead-ball years ended in 1919, batting averages jumped. The Live Ball era (1920–41) had a league batting average of .280, the highest of any era, well above the Dead Ball era (.254) and the Modern era (.254). The peak came in 1930, when the league hit .296 — the best season since 1901 — and 60 qualified hitters batted .300 or better, more than in any other season.

League batting average (hits ÷ at-bats) by era, AL + NL.

  • Live Ball era
  • Other eras

Finding 6

The Steroid era produced the most power

Slugging percentage — total bases per at-bat — tells a different story from batting average. The Steroid era (1994–2005) had the highest league slugging percentage of any era at .424, ahead of the Modern era (.410) and far above the Dead Ball era (.331).

The Modern era hits for less average than the Steroid era (.254 vs. .267) but nearly as much power — which fits the strikeout-and-home-run pattern in Part 1.

League slugging percentage (total bases ÷ at-bats) by era, AL + NL.

  • Steroid era
  • Other eras

Finding 7

The .300 hitter is disappearing

In 1999, 54 of 154 qualified hitters batted .300 or better. In 2025, only 7 of 144 did. The league-wide average tells the same story: in 2022 it fell to .243, the lowest since the "Year of the Pitcher" in 1968 (.237), and it was .245 in 2025.

A qualified hitter has at least 3.1 plate appearances per team game — 502 in a 162-game season.

Number of qualified hitters with a batting average of .300 or better, AL + NL, 1901–2025.

  • Seasons cited in the text: 1930, 1999 and 2025
  • Other seasons
Part three

Players & Careers

Finding 8

Nearly three in ten players are now born outside the US

In the 1920s and 1930s only 1.8% of AL and NL players were born outside the United States. The share began to climb after integration in 1947 and accelerated in the 1990s, reaching 28.8% in the 2020s. In 2025 the Dominican Republic (62 players) and Venezuela (56) sent the most, followed by Cuba (20) and Puerto Rico (19).

The 1870s and 1880s show an earlier bump (9.2% and 8.7%) from players born in Ireland, Canada and England during the first era of pro baseball.

Share of AL + NL players born outside the US, by decade. Each player counts once per decade; players with an unknown birthplace are excluded.

  • 2020s
  • Earlier decades

Finding 9

Left-handed hitters reach base more often

Since 2006, left-handed batters have posted a .329 on-base percentage, compared with .317 for right-handed batters and .325 for switch-hitters. Batting averages are nearly identical (.254 vs. .253 vs. .254), so the lefties' edge comes from walks, not hits: left-handed hitters walked in 9.3% of plate appearances, compared with 7.7% for right-handed hitters.

Left-handed hitters took 32.7% of all plate appearances in this period; right-handed hitters 54.4% and switch-hitters 13.0%.

On-base percentage by batting hand, AL + NL, 2006–2025. Players with unknown batting hand excluded.

  • Left-handed hitters
  • Right-handed and switch-hitters

Finding 10

Six of the top ten career home run hitters played in the Steroid era

Barry Bonds (762) leads the all-time list, ahead of Hank Aaron (755), Babe Ruth (714), Albert Pujols (703) and Alex Rodriguez (696). Six of the top ten — Bonds, Pujols, Rodriguez, Ken Griffey Jr., Jim Thome and Sammy Sosa — played during the Steroid era (1994–2005).

Career totals here include every league in the data set, so Willie Mays's total (660) includes his 1948 season with the Negro American League's Birmingham Black Barons.

Career home runs, all leagues in the data. Bars in red are players whose careers overlapped the Steroid era (1994–2005).

  • Career overlapped the Steroid era (1994–2005)
  • Other careers
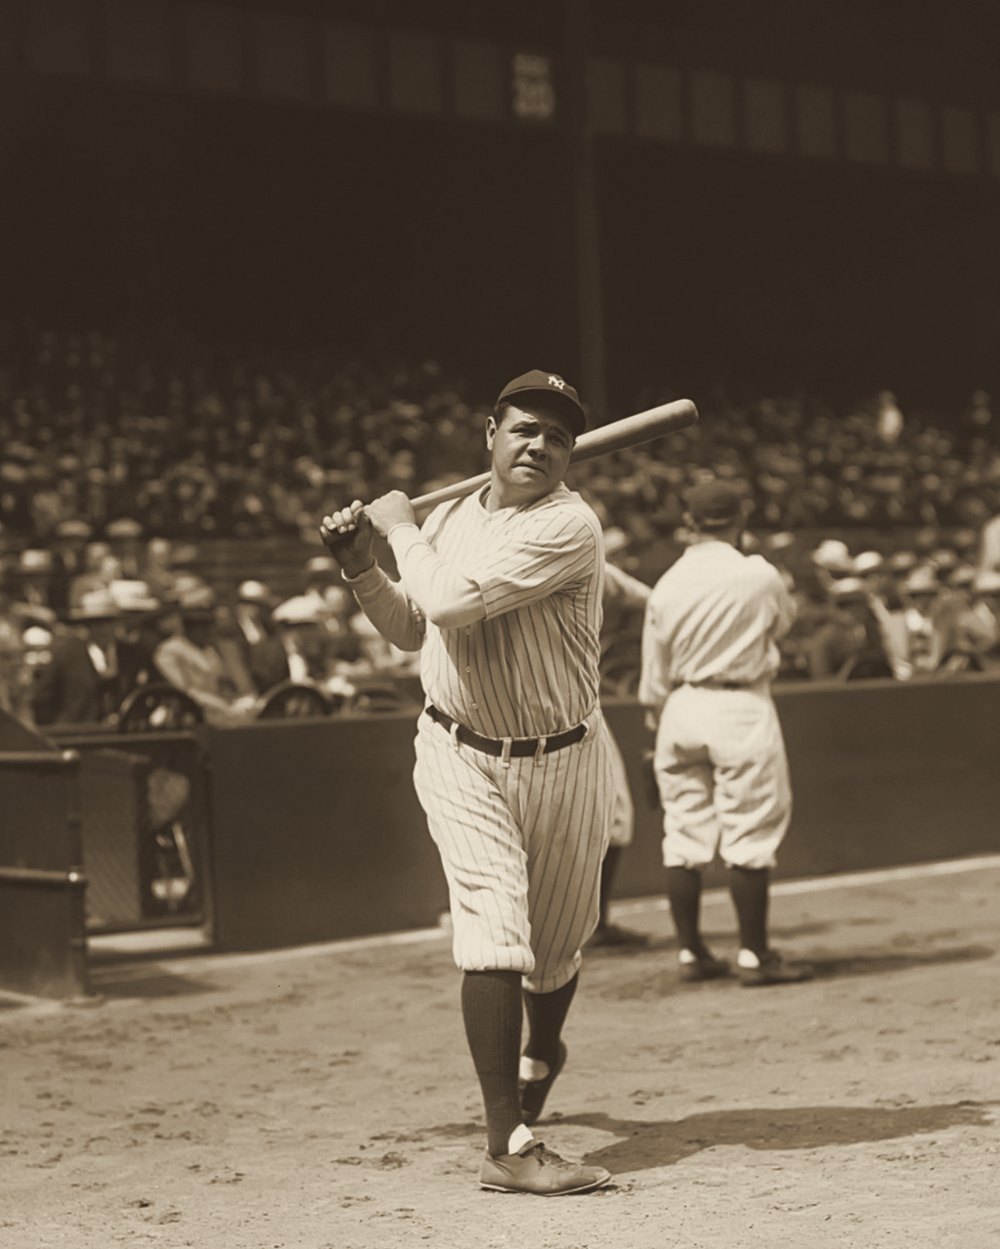
Babe Ruth in Yankees pinstripes taking a warm-up swing in front of a crowded grandstand, about 1927.
Babe Ruth takes a warm-up swing, c. 1927. Photograph by Charles M. Conlon, public domain.

About the data

Source

The Lahman Baseball Database (1871–2025 release, December 10, 2025), maintained by the Society for American Baseball Research (SABR). The site uses four of its tables: Batting (the season batting lines), People (name, batting hand and birth country), Teams and TeamsFranchises (team and franchise names).

What one row is

One row is one player's batting line for one team in one season. A player traded mid-season has one row for each team. When the report ranks individual seasons (qualified hitters, 30-home-run hitters) a player's rows for the same season are added together first.

Rows dropped

The raw Batting table has 128,598 rows. I dropped 22,128 rows with zero at-bats — mostly pitchers who appeared in games without batting — leaving 106,470 rows. No other rows were removed.

Which leagues

The data covers every league SABR recognizes as major: the American and National Leagues, the Negro Leagues (1920–50, plus major-league-caliber independent Black clubs from 1891), and the early National Association, American Association, Union Association, Players' League and Federal League. Findings 1–9 use only AL and NL rows, because the other leagues appear only in some years and many of their records are missing strikeouts, which would distort league-wide trends. 64% of Negro League rows have no strikeout count, and where one exists it covers only some games (0.8% of plate appearances), so the dashboard leaves Negro League rows out of all strikeout numbers. Finding 10 (career totals) uses every league. The dashboard lets you filter by league group.

How each number is calculated

  • Every league or era rate is built from totals — for example, total hits ÷ total at-bats — not an average of individual players' rates.
  • Batting average (AVG) = H ÷ AB.
  • On-base percentage (OBP) = (H + BB + HBP) ÷ (AB + BB + HBP + SF).
  • Slugging percentage (SLG) = total bases ÷ AB, where total bases = singles + 2×doubles + 3×triples + 4×home runs and singles = H − 2B − 3B − HR.
  • Plate appearances (PA) = AB + BB + HBP + SH + SF. Hit-by-pitch, sacrifice hits and sacrifice flies were not recorded in some early seasons; missing values count as 0 in PA and OBP (the convention Baseball-Reference uses).
  • Strikeout rate = SO ÷ PA, using only rows where strikeouts were recorded. Home run rate = HR ÷ PA.
  • Singles share = singles ÷ hits.
  • Qualified hitter = at least 3.1 PA per team game, where team games = the most games any AL or NL team played that season (502 PA in a 162-game season).
  • Foreign-born share = players born outside the US ÷ players with a known birth country, counting each player once per decade.
  • Eras: 19th Century (1871–1900), Dead Ball (1901–19), Live Ball (1920–41), Integration (1942–60), Expansion (1961–76), Free Agency (1977–93), Steroid (1994–2005), Modern (2006–25).

Reproducing the numbers

Running python scripts/build_data.py rebuilds data/batting_clean.csv from the raw files, and python scripts/report_stats.py computes every number on this page into data/report_numbers.json, which the charts load.

Photographs

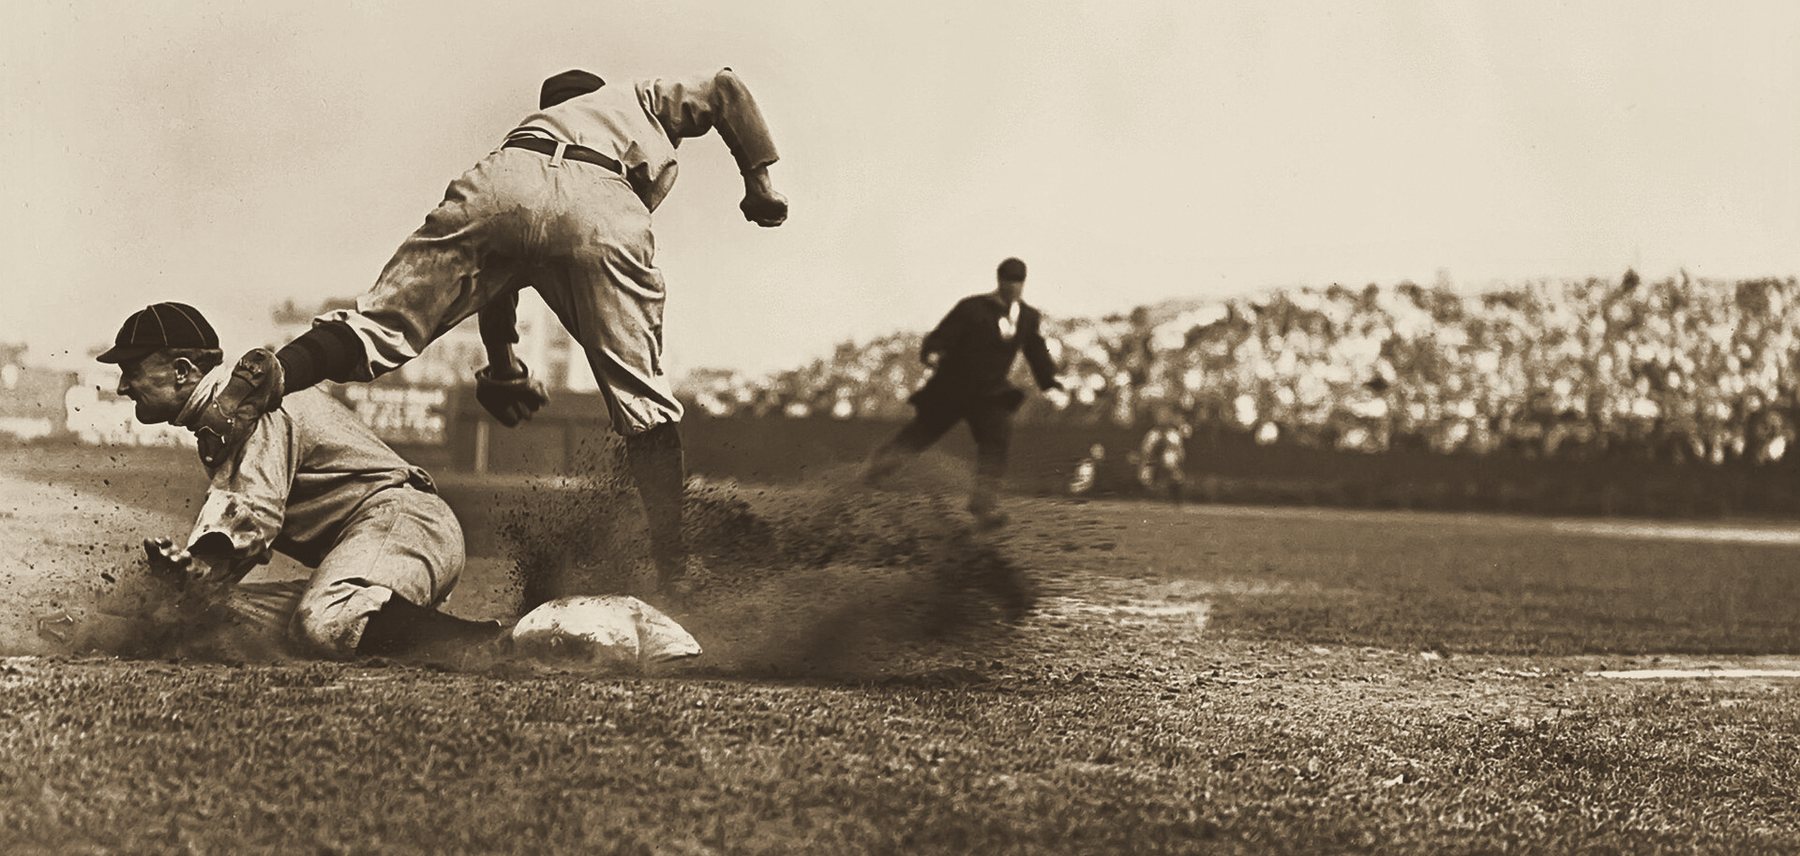
Both photographs are by Charles M. Conlon and are in the public domain, via Wikimedia Commons. They were cropped and toned to match the page.